
Characteristic Analysis of Energy Storage Devices Based on Their Transfer Function

Abstract
This study conducted electrical modeling and comparative analysis of the characteristics of four widely used battery types in electric vehicles and renewable energy systems: (1) lithium iron phosphate (LFP), (2) lithium nickel cobalt manganese oxide (NCM), (3) lithium nickel cobalt aluminum oxide (NCA), and (4) lead-acid batteries. Given the increasing number of recent fire and explosion incidents involving lithium-ion batteries, there is a critical need to enhance their fundamental safety. In this study, an analytical method for energy storage characterization was employed using an impedance frequency range from 1 kHz to 0.1 Hz. Furthermore, reflected wave analysis was employed to monitor internal impedance variations within the batteries. Electrical modeling was conducted using Bode plot analysis in conjunction with MATLAB software, and the energy storage performance of each battery was subsequently evaluated.
Keywords:
Characteristic Analysis, Lithium Battery, Impedance Spectroscopy, Transfer Function1. Introduction
Energy storage devices have gained increasing importance in recent years due to the growing adoption of electric vehicles and renewable energy systems. As a result, numerous studies have focused on the electrical modeling and impedance characterization of these devices.1-4)
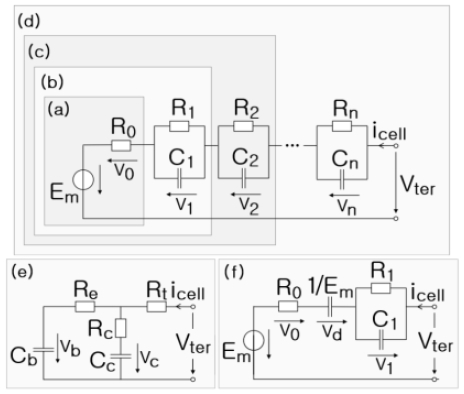
Fig. 1 presents typical equivalent electrical circuit models of representative energy storage devices, including: (a) the Rint model, (b) the Thevenin model, (c) the dual polarization model, (d) the N-RC Thevenin model, (e) the RC model, and (f) the PNGV model.1)
Typical equivalent electrical circuit models used for energy storage devices1)
The Rint model is the simplest equivalent circuit, representing the battery as an ideal voltage source in series with a single internal resistor (R₀), as shown in Fig. 1(a). In contrast, the Thevenin model is a more generalized representation, consisting of a resistor (R₀) in series with a parallel RC network, as illustrated in Fig. 1(b).
The dual polarization and N-RC Thevenin models provide higher accuracy by incorporating multiple RC networks connected in series with a series resistance (R₀), as shown in Fig. 1(c) and Fig. 1(d). In contrast, the RC model does not represent a typical series configuration of a battery; instead, it consists of a series resistance (R₀) and a single RC network connected in series.
Rather, the RC model consists of two resistors (Re and Rt) connected in series, with battery capacitors (Cc) connected in parallel to these resistors, along with an additional RC series circuit connected in parallel. Unlike the series-connected structure of the Thevenin model, the RC model represents a parallel configuration of a series-connected RC circuit, as shown in Fig. 1(e). On the other hand, the PNGV model introduces a capacitor (1/Eₘ) into the middle of the Thevenin model structure, modifying its dynamic response characteristics, as illustrated in Fig. 1(f).1)
The importance of energy storage devices has recently been underscored due to the increasing adoption of electric vehicles and renewable energy sources. Consequently, numerous studies have been conducted on electrical modeling and impedance characterization of these devices.1)-22)
Buller et al.5)-7) investigated the complex-plane impedance spectra over a frequency range from high frequency (fmax) to low frequency (fmin) for lithium-ion batteries and supercapacitors, which are representative energy storage devices. Cylindrical lithium-ion batteries exhibited a semicircular pattern in the complex-plane diagram, whereas supercapacitors were characterized by a slope increasing to approximately 45° at high frequencies, followed by a gradual increase approaching 90° at low frequencies.
Maheshwari et al.8) and Werner et al.9) experimentally investigated the calendar aging of Li-ion cells using electrochemical impedance spectroscopy (EIS). As aging progressed, the impedance spectra in the complex-plane exhibited an enlarged profile, attributed to increased impedance of the energy storage elements and a rise in Warburg impedance, particularly at low frequencies.
Bruj et al.10) predicted the aging behavior of lithium-ion batteries using EIS based on an analysis of 18650 battery properties at various C-rates and charging speeds.
Oldenburger et al.11) analyzed the low-frequency characteristics of energy storage devices and experimentally observed that the Warburg impedance tends to increase as the state of charge (SoC) decreases and the C-rate increases. Cruz-Manzo et al.12) proposed an equivalent electrical circuit model for Li-ion batteries to support EIS studies; this model incorporates both AC impedance and a frequency-dispersive Warburg element.
Li Wang et al.13) synthesized particles for lithium-ion batteries through controlled crystallization and solid-state reaction methods. These particles were subsequently used to investigate the electrochemical performance of half-cells and the impedance spectra of LiNi1/3Co1/3Mn1/3O2, a commonly employed cathode material in lithium-ion batteries.
Ria et al.14) performed impedance spectrum measurements by generating sinusoidal waves, square waves, direct currents, and arbitrary waveforms using a single-chip multipurpose sensor interface. This approach, implemented with a compact low-power ASIC, enabled online high-resolution impedance spectroscopy of lithium-ion batteries.
Fan et al.15) investigated a method based on EIS for estimating the state of health (SoH) of lithium-ion batteries. To experimentally examine capacity degradation over battery cycles, charge–discharge cycling tests and capacity corrections were conducted at room temperature (25°C).
Li et al.16) proposed a method for state estimation of lithium-ion batteries based on impedance spectrum measurements and transfer learning. They experimentally analyzed a battery aging prediction approach using a transfer learning–based neural network to evaluate its effectiveness in accurately estimating battery conditions from EIS data obtained at various temperatures.
Choi et al.17) outlined the fundamental principles of EIS, including circuit modeling techniques, mixed kinetic and diffusion control mechanisms, and practical application methods for lithium-ion batteries.
Kurc et al.18) conducted thermal analyses of lithium-ion batteries to explore strategies for ensuring safe and efficient energy storage. Their study demonstrated that temperature variations influence the rate of electrochemical reactions within the battery, as described by the Arrhenius equation, and are closely related to the properties of the battery materials.
Westerhoff et al.19) characterized battery state by analyzing a lithium-ion battery model based on EIS. They described the underlying electrochemical processes and characteristics of battery cells and experimentally assessed battery state by varying key parameters that significantly influence performance.
Gunter et al.20) explored the use of EIS to assess the wetting degree of lithium-ion cells during the charging process. By comparing EIS response signals with radiographic images, they evaluated the potential of this method to non-invasively determine cell wettability.
This study aims to analyze the characteristics of four types of batteries—(1) lithium iron phosphate (LFP), (2) nickel cobalt manganese (NCM), (3) nickel cobalt aluminum (NCA), and (4) lead-acid batteries—based on their transfer functions.
The parameters of the series inductor (LS), series resistance (RS), parallel resistance (RP), and Warburg resistance (RW) can be identified by analyzing the injected and reflected waveforms over a frequency range from 1 kHz to 0.1 Hz in the energy storage device.
Based on this analysis, the gain margin (GM) and phase margin (PM) can be evaluated as functions of frequency. Furthermore, a method is proposed for comprehensively assessing the performance of an energy storage device by analyzing the gain margin at 0 Hz (GM0Hz).
2. EIS electrical modeling and electrochemical reaction of energy storage devices
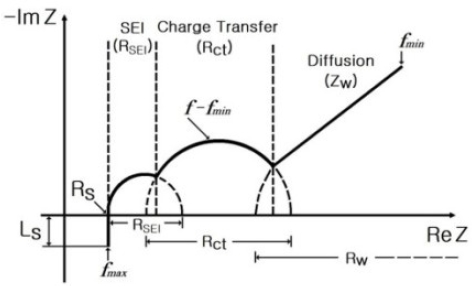
Fig. 2 illustrates the impedance spectrum of energy storage devices plotted in the complex plane.5) In this representation, the series inductance (LS) appears in the high-frequency region (fmax) of the spectrum, while the intercept of the impedance curve on the real axis (ReZ) corresponds to the series resistance (RS) of the energy storage devices.
Complex-plane diagram of the impedance spectrum of energy storage devices
The first semicircle, characterized by the film resistance (RSEI) and constant phase element (QSEI, αSEI), corresponds to the charge transfer processes occurring at the solid electrolyte interphase (SEI) formed on the internal electrode surface.
The second semicircle is defined by the charge transfer resistance (Rct) and the double-layer capacitance element (Qdl, αdl), representing the redox reactions of lithium ions at the electrode–electrolyte interface within the lithium-ion battery.
Furthermore, the diffusion impedance (ZW), which appears in the low-frequency region, is associated with the diffusion of lithium ions. In the complex plane, it is typically represented by a straight line with a slope of approximately 45°, indicating diffusion-controlled behavior.5)
The diffusion impedance (ZW) observed in the low-frequency diffusion region can be expressed as follows8),11),12) :
| (1) |
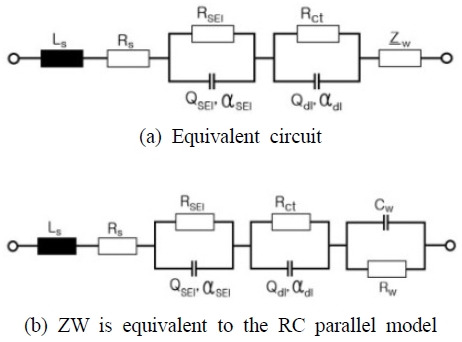
From Fig. 3, the equivalent impedance of an energy storage device can be expressed as5),6),8) :
| (2) |
Equivalent electrical circuits of energy storage devices
The energy storage devices considered in the present study were 1) LFP, 2) NCM, and 3) NCA all of which are based on lithium-ions, and 4) a lead-acid battery.
Table 1 presents the electrochemical reactions of LFP, NCM, NCA, and lead-acid batteries.21-22)

Electrochemical reactions of LFP, NCM, NCA and lead-acid batteries
3. Characteristic analysis based on the transfer function of the energy storage devices
Examples of energy storage device models include the (1) Rint, (2) Thevenin, (3) dual polarization, (4) N-RC, (5) RC, and (6) PNGV models.1) This study employed the Thevenin model, which is the most widely used, and conducted analysis by incorporating LS and RW into the model.
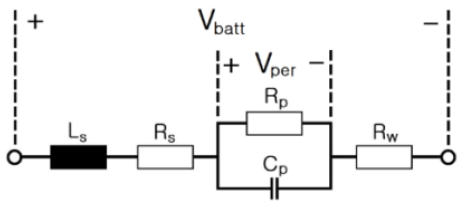
Fig. 4 illustrates a simplified equivalent electrical circuit of the energy storage devices.
Equivalent electrical circuit of energy storage devices
Fig. 3 presents a detailed equivalent circuit. However, since RSEI and CW are very small, Figure 4 illustrates a simplified equivalent circuit composed of parameters that can be practically measured. Thus, this paper includes additional discussion on the rationale behind using Figure 4.
When a voltage Vbatt(t) is applied to the energy storage device and a current i(t) flows through it, the voltages across LS, RS, RP, CP and RW can be expressed in the Laplace domain as follows:
| (3) |
| (4) |
| (5) |
| (6) |
Therefore, the Laplace-transformed expression for the voltage of the energy storage device is given as follows:
| (7) |
The transfer function of the energy storage device can be expressed as follows:
| (8) |
Using the values of LS, RS, RP, CP and RW obtained from the previous experimental results, the gain margin (GM) and phase margin (PM) were calculated using MATLAB (Version 9.4).
Fig. 5 presents the Bode plots of the energy storage devices at SoC levels of 0% and 100%.
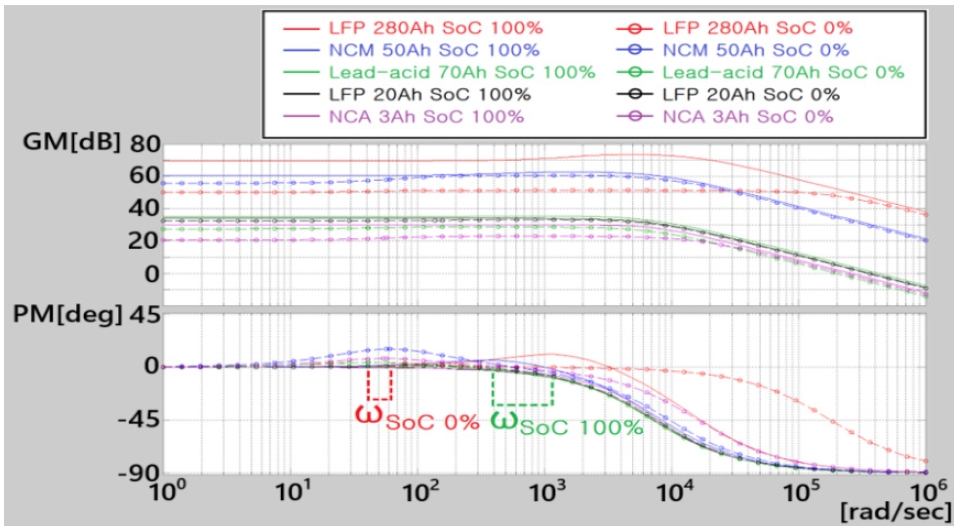
Bode plots of the energy storage devices
For the energy storage devices, the GM decreased when the angular frequency (ω = 2πf) exceeded 104 rad/s (frequency: 1,500
Hz), and it was constant as the angular frequency approached 0 rad/s (frequency: 0 Hz).
Thus, the GM showed characteristics typical of those of a typical low-pass filter (LPF).
The GM of the energy storage devices at 0 rad/s (frequency: 0 Hz), denoted by GM0Hz, was calculated using the equation :
| (9) |
From this equation, GM0Hz was calculated as follows for each energy device.
The GM0Hz value proposed in this study can be considered to be an indicator of the energy storage device performance. Generally, energy storage devices store DC power. Therefore, for a high GM at 0 Hz, the higher the GM0Hz value, the lower the internal impedance.
By contrast, for a low GM at 0 Hz, the battery’s impedance is high while its performance is reduced.
In Fig. 6, the internal impedance characteristics of the energy storage devices can be compared by comparing the GM curves and GM0Hz in the Bode plot based on the transfer function.
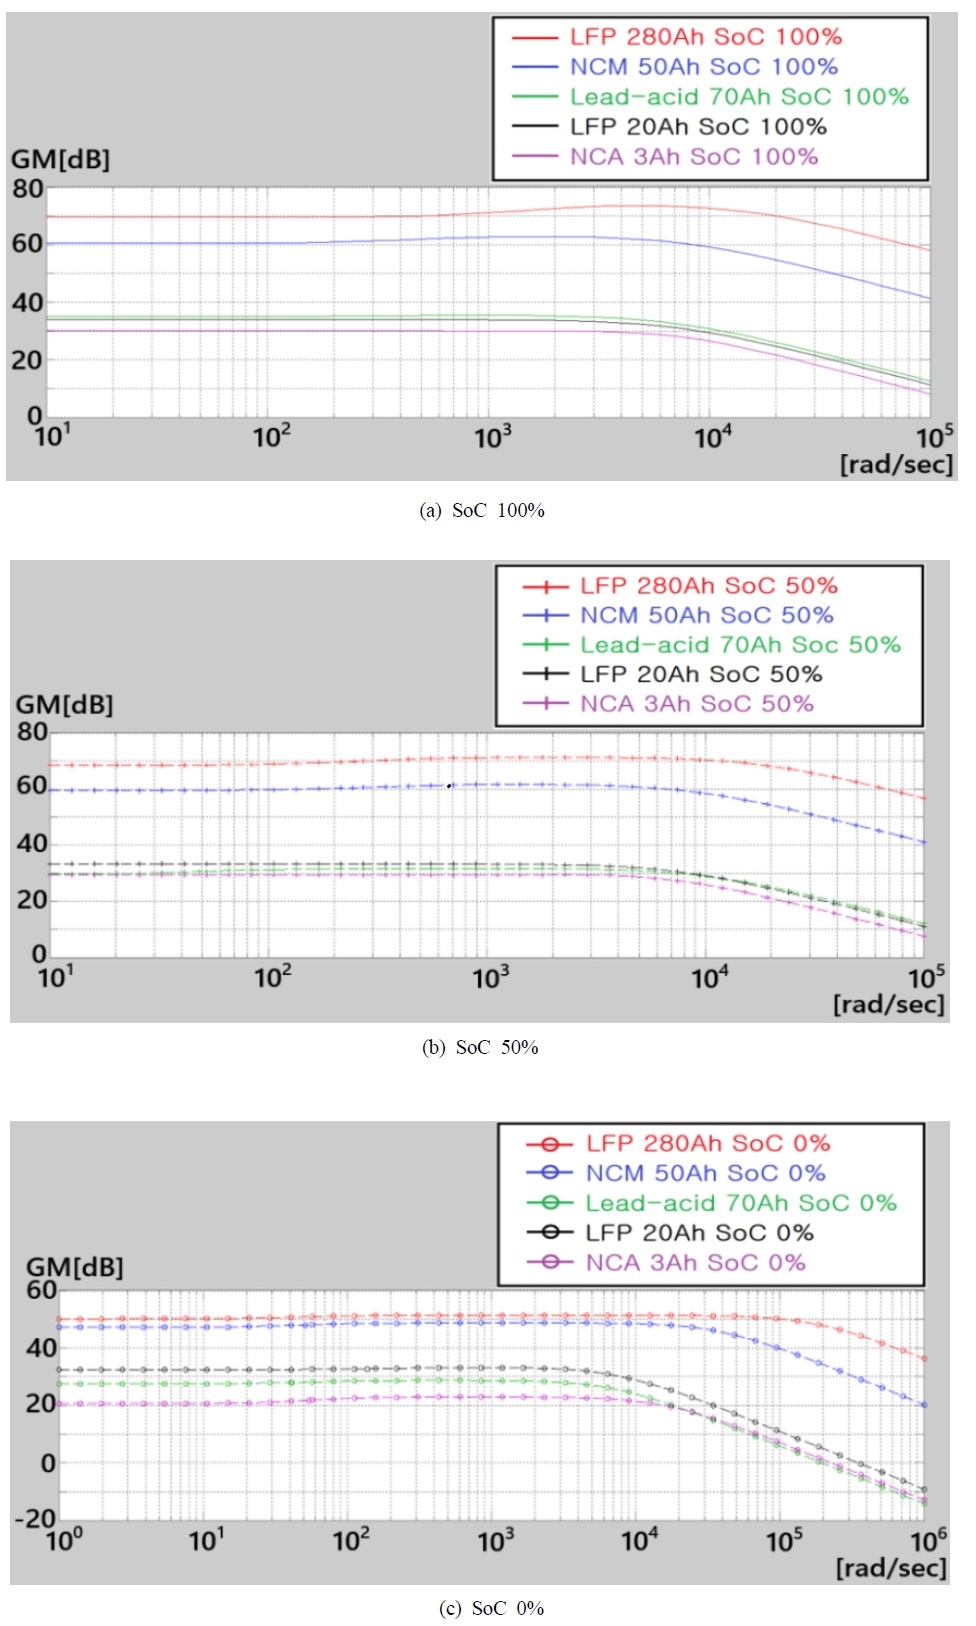
GM curves of energy storage devices at SoC levels of 100%, 50%, and 0%
Fig. 6(a) presents the impedance spectrum of the energy storage device at 100% SoC. It is evident that the performance of the devices at full charge follows the order below, ranked by increasing distance from the origin in the complex plane:
At 100% SoC, the impedance response of the devices, in order of increasing distance from the origin in the complex plane, is as follows: the 280 Ah LFP, the 50 Ah NCM, the 70 Ah lead-acid, the 20 Ah LFP, and the 3 Ah NCA battery.
In Fig. 6(b), at 50% SoC, the impedance spectra of the lead acid battery and the 20 Ah LFP battery intersect. At this SoC level, the lead-acid battery exhibits a marked increase in low-frequency diffusion resistance.
Fig. 6(b) illustrates the impedance curves of the energy storage devices, arranged along the real axis ReZ from the origin of the complex plane. The devices are ordered as follows, based on increasing distance from the origin:
At 50% SoC, the impedance curves of the devices, ranked by increasing distance from the origin on the real axis, are as follows: the 280 Ah LFP, the 50 Ah NCM, the 20 Ah LFP, the 70 Ah lead-acid, and the 3 Ah NCA battery.
In Fig. 6(c), at 0% SoC, the impedance spectra of the NCA and lead acid batteries intersect.
Fig. 6(c) also presents the variation of the GM with frequency at 0% SoC, where the battery performance can be ranked as follows:
At 0% SoC, the battery performance, ranked by increasing distance from the origin in the impedance spectrum, is as follows: the 280 Ah LFP, the 50 Ah NCM, the 20 Ah LFP, the 70 Ah lead-acid, and the 3 Ah NCA battery.
- ∎280 Ah LFP battery :
- - GM0Hz SoC 100% = 69.4939 dB
- - GM0Hz SoC 50% = 68.5240 dB
- - GM0Hz SoC 0% = 50.1292 dB
- ∎50 Ah NCM battery :
- - GM0Hz SoC 100% = 60.5736 dB
- - GM0Hz SoC 50% = 59.5572 dB
- - GM0Hz SoC 0% = 47.2063 dB
- ∎70 Ah Lead-acid battery :
- - GM0Hz SoC 100% = 35.0486 dB
- - GM0Hz SoC 50% = 29.5522 dB
- - GM0Hz SoC 0% = 27.4434 dB
- ∎20 Ah LFP battery :
- - GM0Hz SoC 100% = 33.9577 dB
- - GM0Hz SoC 50% = 33.2950 dB
- - GM0Hz SoC 0% = 32.5100 dB
- ∎3 Ah NCA battery :
- - GM0Hz SoC 100% = 30.0296 dB
- - GM0Hz SoC 50% = 29.2501 dB
- - GM0Hz SoC 0% = 20.6528 dB
4. Experimental Results
Fig. 7 illustrates the experimental setup employed for measuring the impedance of various energy storage devices. Fig. 8 presents a comparative analysis of the impedance characteristics for the following batteries: (a) a square-type LFP battery (280 Ah), (b) a lithium pouch-type NCM battery (50 Ah), (c) a lead-acid battery (70 Ah), (d) a cylindrical LFP battery (20 Ah), and (e) a cylindrical NCA battery (3 Ah).
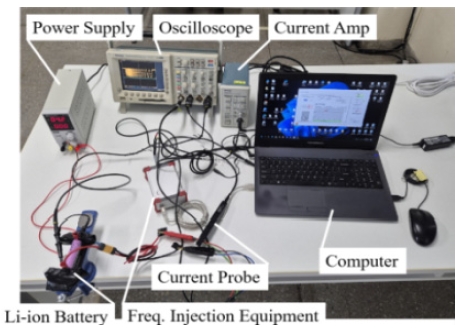
Photograph of the experimental setup used in the present study
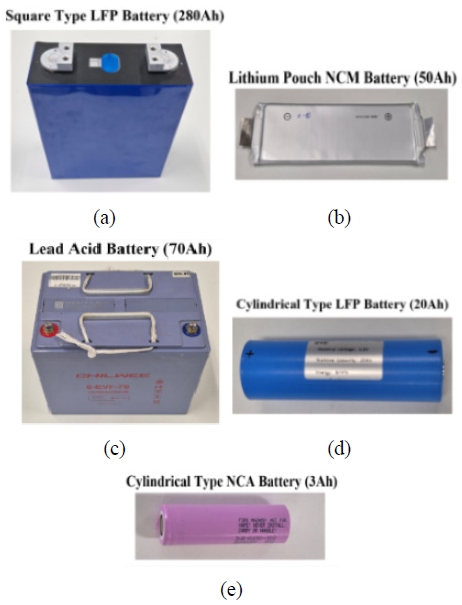
Comparison of the impedance of energy storage devices
- ∎280 Ah LFP battery :
- - nominal voltage : 3.2 V
- - nominal current : 280 Ah
- - size : 70 × 174 × 204 mm (box type)
- - weight : 5.25 kg
- - cathode material : LiFePO4
- - company : EVE Energy Co., Ltd., China
- ∎50 Ah NCM battery :
- - nominal voltage : 3.65 V
- - nominal current : 50 Ah
- - size : 95 × 300 × 12 mm (box type)
- - weight : 1.5 kg
- - cathode material : NCM
- - company : Shenzhen Aoyouji Energy Electronics Co., Ltd., China
- ∎70 Ah Lead-acid battery :
- - nominal voltage : 12 V
- - nominal current : 70 Ah
- - size : 326 × 167 × 168 mm (box type)
- - weight : 26 kg
- - cathode material : PbO2
- - company : Chaowei Power Co., Ltd., China
- ∎20 Ah LFP battery :
- - nominal voltage : 3.2 V
- - nominal current : 20 Ah
- - size : length 130 mm, diameter 40 mm (cylindrical type)
- - weight : 600 g
- - cathode material : LiFePO4
- - company : EVE Energy Co., Ltd., China
- ∎3 Ah NCA battery :
- - nominal voltage : 3.65 V
- - nominal current : 3 Ah
- - size : length 65 mm, diameter 18 mm (cylindrical type)
- - weight : 48 g
- - cathode material : NCA
- - company : Samsung Co., Ltd., Korea
Fig. 9 presents the applied voltage and resulting current waveforms observed during the impedance spectrum measurements, covering a frequency range from 1 kHz to 0.1 Hz. These measurements were conducted to analyze the dynamic responseand internal characteristics of each battery.
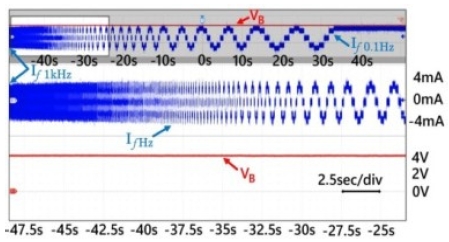
Voltage and current waveforms during the measurement of the impedance spectrum
Fig. 10(a) depicts the complex-plane impedance spectra of the energy storage devices measured at 100% SoC. The arrangement of the spectral features at full SoC is described as follows.
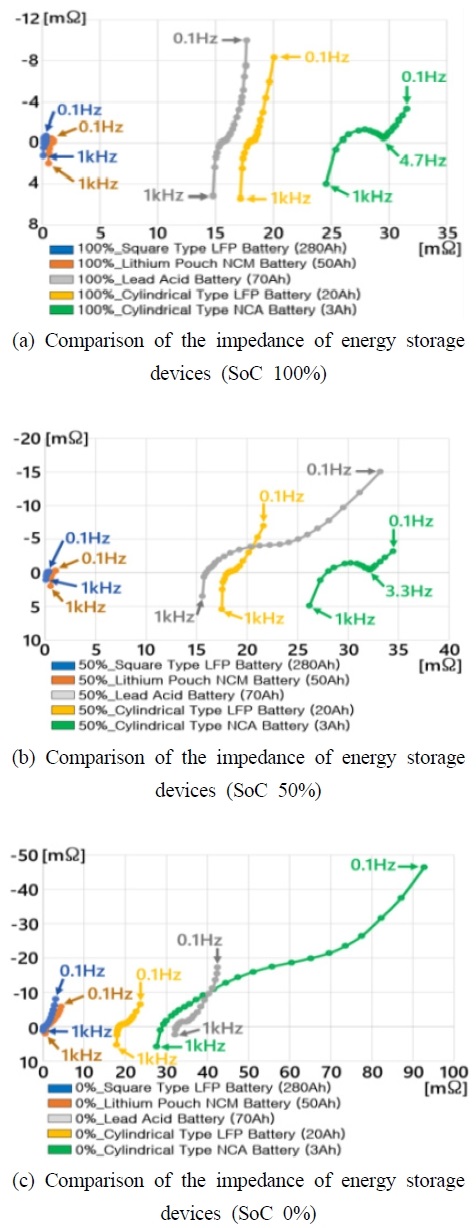
Impedance spectra of energy storage devices for different SoC values
At a SoC of 100%, the order of the impedance magnitude (or spectral response) among the energy storage devices is as follows: the 280 Ah LFP battery exhibits the highest value, followed by the 50 Ah NCM battery, the 70 Ah lead-acid battery, the 20 Ah LFP battery, and finally the 3 Ah NCA battery.
Fig. 10(b) illustrates the complex-plane impedance spectra of the energy storage devices at 50% SoC. At this SoC level, the impedance curves of the lead-acid battery and the 20 Ah LFP battery intersect, indicating a shift in relative impedance behavior. In particular, the lead-acid battery shows a pronounced increase in impedance within the low-frequency diffusion-dominated region.
Fig. 10(c) illustrates the complex-plane impedance spectra of the energy storage devices at 0% SoC. The initial points of the impedance curves—representing the high-frequency region—are observed to follow the sequence described below.
At a SoC of 0%, the starting points of the impedance spectra appear in the following order: the 280 Ah LFP battery shows the lowest initial impedance, followed by the 50 Ah NCM battery, the 20 Ah LFP battery, the 3 Ah NCA battery, and finally the 70 Ah lead-acid battery, which exhibits the highest initial impedance.
At 0% SoC, the impedance of the NCA battery increases rapidly in the low-frequency diffusion region, resulting in an intersection between the impedance curves of the NCA and lead-acid batteries.
As the SoC decreases to 0%, the impedance of both the lead-acid and NCA batteries increases most rapidly. In particular, it was experimentally confirmed that the Warburg impedance of the NCA battery exhibited a pronounced increase in the low-frequency diffusion region, as identified in prior studies.
Fig. 11 presents the impedance spectra of the energy storage devices at various SoCs. Among the devices tested, the 280 Ah LFP battery exhibited the lowest impedance and superior performance, followed by the NCM battery. The lead-acid battery showed a rapid increase in impedance at 50% SoC, while the NCA battery demonstrated a notable increase in Warburg impedance at 0% SoC.
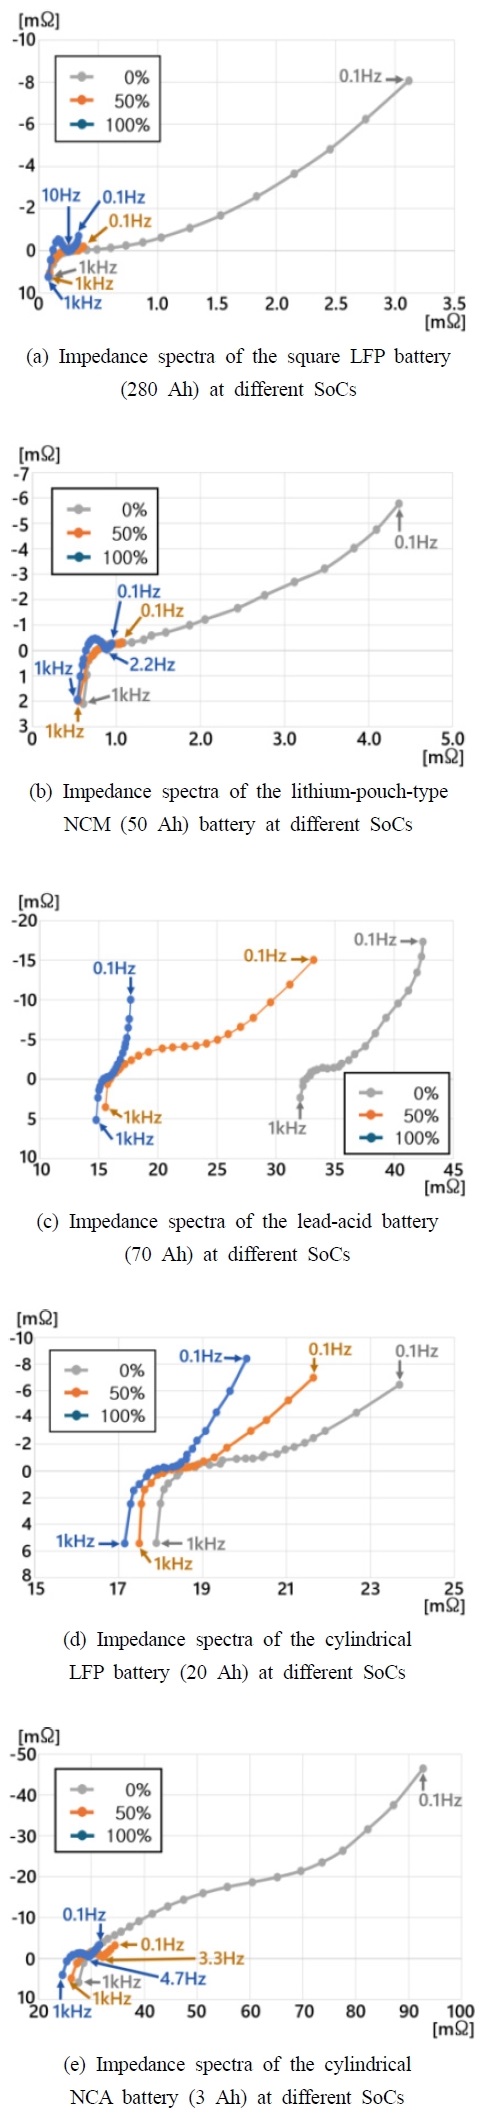
Impedance spectra of each of the energy storage devices at different SoC values
Table 2 summarizes the experimentally measured parameters for the following batteries: (a) LFP (280 Ah), (b) NCM (50 Ah), (c) lead-acid (70 Ah), (d) LFP (20 Ah), (e) and NCA (3 Ah) batteries.
Ls, Rs, Rp, and Cp values of each energy storage devices
5. Conclusion
This study presents electrical modeling and comparative analysis of four types of energy storage devices: (1) a LFP battery, (2) a NCM battery, (3) a NCA battery, and (4) a lead-acid battery. Additionally, it proposes equivalent electrical circuit models for each storage device and derives corresponding transfer functions using the Laplace transform.
In the Bode plots of the energy storage devices, analyzed based on the frequency response of the transfer function, the GM0Hz was considered as a performance indicator of the devices.
Table 3 presents the variation of key parameters for the energy storage devices.
Variation of Key Parameters by Battery Type
The impedance characteristics of various energy storage devices—including 280 Ah LFP, 50 Ah NCM, 70 Ah lead-acid, 20 Ah LFP, and 3 Ah NCA batteries—were analyzed under different SoCs. In addition, variations in the equivalent circuit parameters Ls, Rs, Rp, Cp and Rw were investigated for each device.
In particular, both Cp and Ls increased as the SoC decreased, whereas the gain margin at GM0Hz decreased with lower SoC. At 0% SoC, unlike at 50% and 100% SoC, Rw increased due to diffusion effects, resulting in a corresponding increase in Cp.
The Bode plots of the energy storage devices were compared based on the electrical modeling, and the range of GM0Hz was found to be 20.6528–69.4939 dB.
The energy storage devices are capable of storing DC power, and a higher gain margin at GM0Hz indicates better battery performance. Based on the developed electrical models of the energy storage devices, an improved battery management strategy was proposed.
This paper presents a comparative analysis of different energy storage devices using three key criteria: (1) impedance spectroscopy, (2) Bode plot analysis conducted via MATLAB, and (3) GM0Hz.
- Symbol explanation -
| EIS : | electrochemical impedance spectroscopy |
| SoC : | state of charge |
Author contributions
J. Y. Bae; Conceptualization, Investigation, Methodology, Visualization, Validation, Writing-original, Project adminstration, Supervision & editing. M. H. Kim; Investigation, Resources & Visualization.
References
-
M. Schmid, U. Vögele and C. Endisch, 2020 “A novel matrix-vector-based framework for modeling and simulation of electric vehicle battery packs”, Journal of Energy Storage, 32, 101736.
[https://doi.org/10.1016/j.est.2020.101736]

-
P. J. Bugryniec, J. N. Davidson and S. F. Brown, 2020, “Advanced Abuse Modelling of Li-ion Cells – A Novel Description of Cell Pressurisation and Simmering Reactions”, Journal of Power Sources, 474, 228396.
[https://doi.org/10.1016/j.jpowsour.2020.228396]
-
M. Chen and G. A. Rincón-Mora, 2006, “Accurate Electrical Battery Model Capable of Predicting Runtime and I–V Performance”, IEEE Trans. Energy Conv., 21(2), 504-511.
[https://doi.org/10.1109/TEC.2006.874229]
-
R. Xiong, F. Sun, Z. Chen and H. He, 2014, “A data-driven multi-scale extended Kalman filtering based parameter and state estimation approach of lithium-ion polymer battery in electric vehicles”, Applied Energy, 113, 463-476.
[https://doi.org/10.1016/j.apenergy.2013.07.061]
-
S. Buller, M. Thele, R. W. D. Doncker and E. Karden, 2005, “Impedance-Based Simulation Models of Supercapacitors and Li-Ion Batteries for Power Electronic Applications”, IEEE Trans. Ind. App., 41(3), 742-747.
[https://doi.org/10.1109/TIA.2005.847280]
-
S. Buller, E. Karden, D. Kok and R. W. D. Doncker, 2002, “Modeling the Dynamic Behavior of Supercapacitors Using Impedance Spectroscopy”, IEEE Trans. Ind. App., 38(6), 1622-1626.
[https://doi.org/10.1109/TIA.2002.804762]
-
E. Karden, S. Buller and R. W. D. Doncker, 2002, “A frequency-domain approach to dynamical modeling of electrochemical power sources”, Electrochimica Acta, 47, 2347-2356.
[https://doi.org/10.1016/S0013-4686(02)00091-9]
-
A. Maheshwari, M. Heck and M. Santarelli, 2018, “Cycle aging studies of lithium nickel manganese cobalt oxide-based batteries using electrochemical impedance spectroscopy”, Electrochimica Acta, 273, 335-348.
[https://doi.org/10.1016/j.electacta.2018.04.045]
-
D. Werner, S. Paarmann and T. Wetzel, 2021, “Calendar Aging of Li-Ion Cells—Experimental Investigation and Empirical Correlation”, Batteries, 7(28), 1-23.
[https://doi.org/10.3390/batteries7020028]
-
O. Bruj and A. Calborean, 2024, “EIS Ageing Prediction of Lithium-Ion Batteries Depending on Charge Rates”, Batteries, 10(247), 1-16.
[https://doi.org/10.3390/batteries10070247]
-
M. Oldenburger, B. Bedürftig, A. Gruhle, F. Grimsmann, E. Richter, R. Findeisen and A. Hintennach, 2019, “Investigation of the low frequency Warburg impedance of Li-ion cells by frequency domain measurements”, Journal Energy Storage, 21, 272-280.
[https://doi.org/10.1016/j.est.2018.11.029]
-
S. Cruz-Manzo and P. Greenwood, 2020, “An impedance model based on a transmission line circuit and a frequency dispersion Warburg component for the study of EIS in Li-ion batteries”, J. Electroanal. Chem., 871, 114305.
[https://doi.org/10.1016/j.jelechem.2020.114305]
-
L. Wang, J. Zhao, X. He, J. Gao, J. Li, C. Wan and C. Jiang, 2012, “Electrochemical Impedance Spectroscopy (EIS) Study of LiNi1/3Co1/3Mn1/3O2 for Li-ion Batteries”, Int. Journal Electrochem. Sci., 7, 345-353.
[https://doi.org/10.1016/S1452-3981(23)13343-8]
-
A. Ria, G. Manfredini, F. Gagliardi, M. Vitelli, P. Brusch and M. Piotto, 2023, “Online High-Resolution EIS of Lithium-Ion Batteries by Means of Compact and Low Power ASIC”, Batteries, 9(239), 1-23.
[https://doi.org/10.3390/batteries9050239]
-
M. Fan, M. Geng, K. Yang, M. Zhang and H. Liu, 2023, “State of Health Estimation of Lithium-Ion Battery Based on Electrochemical Impedance Spectroscopy”, Energies, 16(3393), 1-14.
[https://doi.org/10.3390/en16083393]
-
Y. Li, M. Maleki and S. Banitaan, 2023, “State of health estimation of lithium-ion batteries using EIS measurement and transfer learning”, J. Energy Storage, 73, 109185.
[https://doi.org/10.1016/j.est.2023.109185]
-
W. S. Choi, H. C. Shin, J. M. Kim, J. Y. Choi and W. S. Yoon, 2020, “Modeling and Applications of Electrochemical Impedance Spectroscopy (EIS) for Lithium-ion Batteries”, Journal Electrochem. Sci. Technol., 11(1), 1-13.
[https://doi.org/10.33961/jecst.2019.00528]
-
B. Kurc, X. Gross, E. Rudnicka and Ł. Rymaniak, 2024, “Thermal Studies of Lithium-Ion Cells: Ensuring Safe and Efficient Energy Storage”, Energies, 17 (1993), 1-17.
[https://doi.org/10.3390/en17091993]
-
U. Westerhoff, K. Kurbach, F. Lienesch and M. Kurrat, 2016, “Analysis of Lithium-Ion Battery Models Based on Electrochemical Impedance Spectroscopy”, Energy Technology, 4, 1620-1630.
[https://doi.org/10.1002/ente.201600154]
-
F. J. Gunter, J. B. Habedank, D. Schreiner, T. Neuwirth, R. Gilles and G. Reinhart, 2018, “Introduction to Electrochemical Impedance Spectroscopy as a Measurement Method for the Wetting Degree of Lithium-Ion Cells”, J. Electrochem. Soc., 165(14), A3249-3256.
[https://doi.org/10.1149/2.0081814jes]
-
M. K. Tran, A. DaCosta, A. Mevawalla, S. Panchal and M. Fowler, 2021, “Comparative Study of Equivalent Circuit Models Performance in Four Common Lithium-Ion Batteries: LFP, NMC, LMO, NCA”, Batteries, 7(51), 1-15.
[https://doi.org/10.3390/batteries7030051]
- M. A. Casacca, 1989, “Mathematical model of a lead acid battery”, Master’s thesis of Lowell University, 1-42.